Flame graphs and perf-top for JVMs inside Docker containers
To learn about flame graphs and perf with Java see Brendon Gregg’s post and a talk Nitsan Wakart’s talk at Devoxx UK on the topic and come back armed with knowledge of perf-map-agent and perf.
Right ready for some beautiful flame graphs?
TL;DR I’ve created some scripts that given a Docker container id and the host PID generates a flame graph or runs perf top for a JVM inside a Docker container.

Perf-map-agent generates flame graphs and allows perf top for Java programs by:
- attaching to the JVM and getting a symbol map
- running perf top of perf record with the map file
When a JVM is inside a Docker container it’s inside its own PID namespace typically running as a user that only exists inside the container.
This means that the JVM appears to have a different PID on the host than it does in the container.
To attach to a JVM and get the symbol map the jvmstat file (files in
/tmp/hsperfdata_<user>/<PID>) is used, this file
will be in the container tmp directory named after the container PID. Typically only
the user that owns the JVM can attach to the JVM.
When perf is run from the host it’ll look (by default) for a mapping file in the
host tmp directory (/tmp/perf-<PID>.map). It isn’t advised to run anything as root
in the container so being able to run perf in the container would be a gaping security hole.
Perf map agent without containers puts the symbol map file where perf expects it.
So to make this work:
- mount perf-map-agent inside each of our containers (e.g. have it on every server and mount the volume read only)
- get the symbol map from inside the container using the container PID and copy it to the host tmp directory. Renaming it from the container PID to the host PID
- run perf on the host as root to get top or a flame graph
Here’s a snippet from a very noddy web application to demonstrate this in action. It is a fantastic application that has an endpoint that calculates all the primes up to a given number (ignoring all efficient ways of doing it).
@GET
@Path("/count-prime/{num}")
public String callout(@PathParam("num") long num) {
    long primes = 0;
    for (int i = 0; i < num; i++) {
       if (isPrime(i)) primes++;
    }
    return String.valueOf(primes);
}

boolean isPrime(long n) {
    for(int i=2;i<n;i++) {
        if(n%i==0)
            return false;
    }
    return true;
}
It’s currently running inside a Docker container (and as root as this is on my laptop not in production :P)
First, find the process on the host:
➜  docker-jvm-perf ps -ef | grep dropwizard-app | grep " java "
root     24554 20722 11 20:10 ?        00:00:05
java -XX:NativeMemoryTracking=summary -XX:+UnlockDiagnosticVMOptions -XX:+AlwaysPreTouch -XX:+UseG1GC -XX:+PrintGC -XX:+PrintGCDateStamps -XX:+PrintGCTimeStamps -XX:+PrintGC -jar
/data/dropwizard-app-all.jar server /data/config.yml
You can also use tools like systemd-cgls to see which processes are in each
docker container. The cgroup name will be the same as your container id.
Or docker inspect if the JVM is PID 1 inside the container.
The host PID here is 24554.
Running ps inside the container (so in the PID namespace of the container):
docker-jvm-perf docker exec  6ee59c68e1f9 ps -ef | grep java
root         1     0  0 20:10 ?        00:00:00 /usr/bin/python3 -u /sbin/my_init -- /start_java.sh -c -jar /data/dropwizard-app-all.jar server /data/config.yml
root        10     1  0 20:10 ?        00:00:00 /bin/bash -x /start_java.sh -c -jar /data/dropwizard-app-all.jar server /data/config.yml
root        15    10  2 20:10 ?        00:00:05 java -XX:NativeMemoryTracking=summary -XX:+UnlockDiagnosticVMOptions -XX:+AlwaysPreTouch -XX:+UseG1GC -XX:+PrintGC -XX:+PrintGCDateStamps -XX:+PrintGCTimeStamps -XX:+PrintGC -jar /data/dropwizard-app-all.jar server /data/config.yml
The PID inside the container is 15. Don’t be fooled, this is the process we
are looking for, it is just the Linux PID namespace in action.
We can see the jvmstat files inside the container:
➜  docker-jvm-perf docker exec -it  6ee59c68e1f9 bash
root@ca94c4ffdb3f:/# ll /tmp
total 0
drwxrwxrwt.  3 root root  29 Oct 31 20:10 ./
drwxr-xr-x. 22 root root 287 Oct 31 20:10 ../
drwxr-xr-x.  2 root root  16 Oct 31 20:10 hsperfdata_root/
root@ca94c4ffdb3f:/# ll /tmp/hsperfdata_root/15
-rw-------. 1 root root 32768 Oct 31 20:15 /tmp/hsperfdata_root/15
So given a container ID and a host process ID we can run:
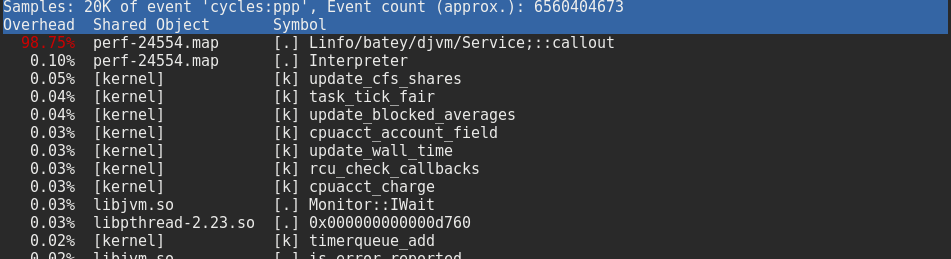
➜ bin git:(docker-support) ✗ ./docker-perf-top 6ee59c68e1f9 24554
You can see C1 and C2 kick in if you run this a few times (each time a new symbol map is generated which will be updatd based on what the JIT compiler has been up to).
Quickly the isPrime method gets inlined and we see that nearly all the time is spent in the callout method (see Nitsan’s talk on how to see inlined methods in perf if that is what you desire).
And then for a flame graph:
➜ bin git:(docker-support) ✗ ./docker-perf-java-flames 6ee59c68e1f9 24554

Unsurprisingly we spend all our time in callout as it is busy calculating our primes.
Here’s my fork of perf-map-agent (branch docker-support) with the docker perf map scripts.
It assumes:
- perf-map-agent is mounted inside the container at:
/perf-map/ - you have root access on the container host
- Jps is on the path inside the container
- you have a single JVM inside the container
- the host has the necessary shared objects
There’s a lot of duplication at the moment which I intend to remove and then
raise a PR as well as the same for rkt (alternative to Docker).
Happy profiling!